
As a performance modeling and analysis approach, PN modeling includes three parts: using the visual notation to model the application running as a DRE system, measuring the environment overheads and calculating the performance metrics using the prediction algorithms.
The visual notation is used by application developers to build a PN model of a DRE application. The notation provides icons to represent the application and network structure and the environment overheads. The application and network structure are […]
The visual notation of PN modeling helps application developers obtain a graphic view of the performance of a DRE system. The visual notation captures the relevant aspects of the GeoSurv II UAV application, its network architecture and deployments that are needed for the GeoSurv II UAV application performance analysis. […]

Figure 11: An example of an application diagram, p. 55.
Application diagrams for each mode of the application are drawn first to show the publish/subscribe relationships between processes and messages to help application developers abstract the application structure in a graphical way. Figure 11 shows an example of an application diagram with two processes named P_6, and P_7 and one Message named M_1O. The processes are represented by parallelograms with their process IDs and priorities, and the message is shown as a directed line with its message ID and its priority. P_6 publishes M_10 that is subscribed by P_7. The priority of P_6 is marked as 51, and the priority of P_7 is marked as 52. The message M_10's priority is 20. […]
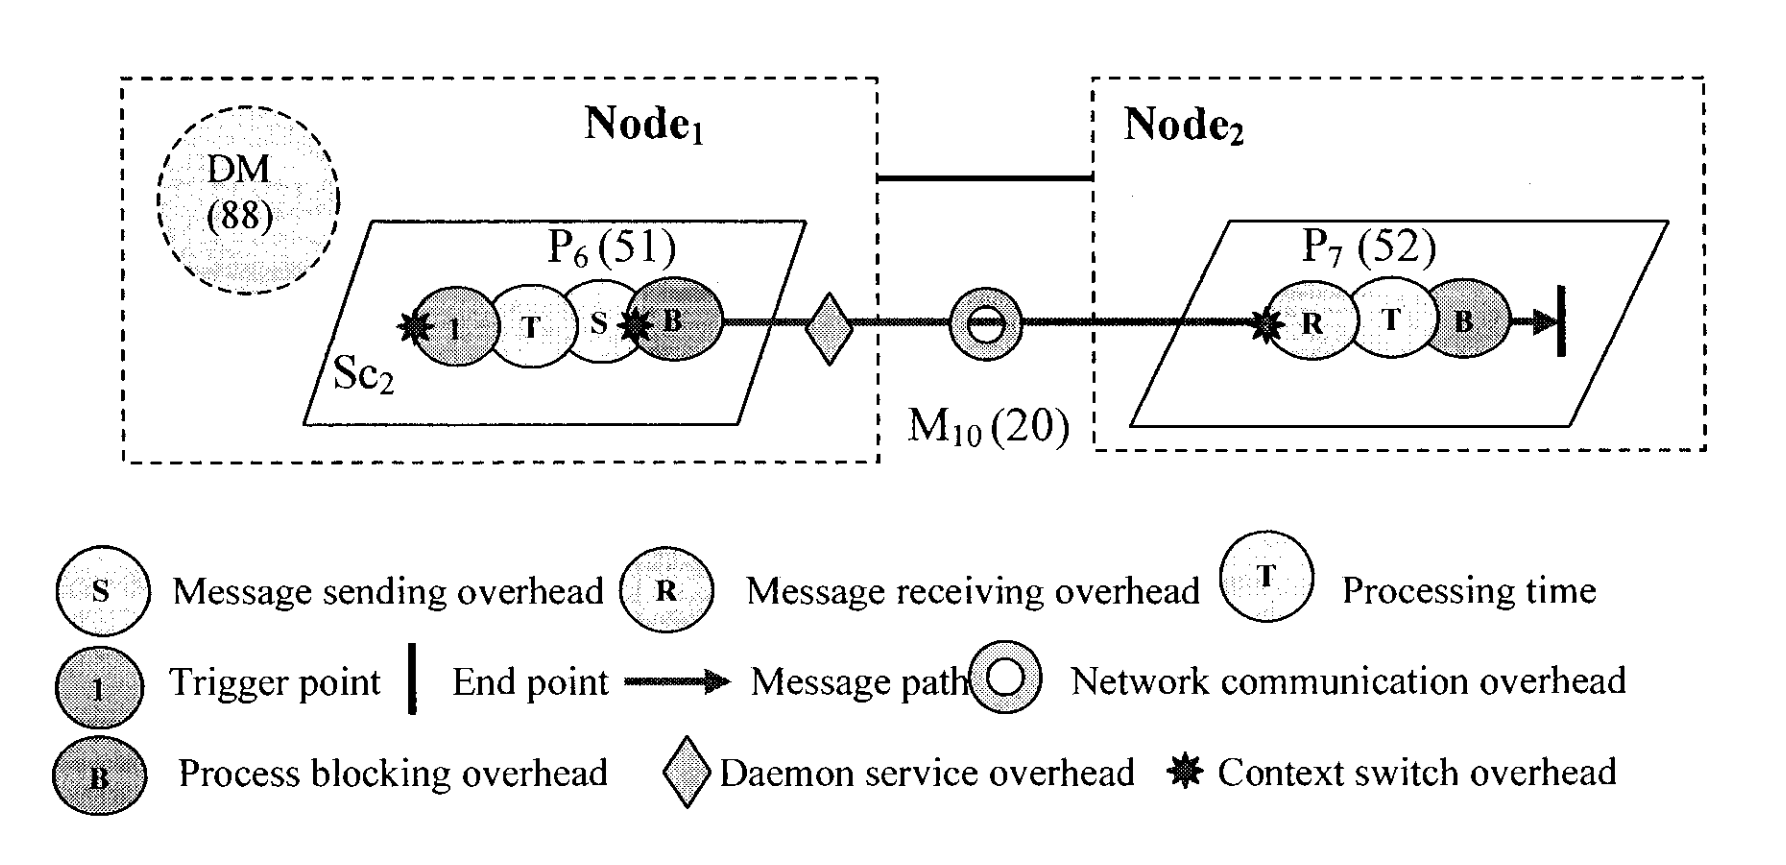
Figure 13: An example of a scenario diagram, p. 57.