Causal loop diagramming (also termed systems mapping) is a principal qualitative system thinking tool used both inside academia and for communicating with policymakers and the general public [20].
Causal loop diagrams (CLDs) constitute a schematic description of the considered system depicting its components and the (causal) relations between them. Components are connected by directed links. Each link represents an impact (causal influence) of one component on another. The impact can be positive, in which case an increase/decrease of the state of the impacting component leads to an increase/decrease of the state of the impacted component, or negative, in which case an increase/decreases of the state of the impacting component leads to the opposite change of the state of the impacted component, i.e., a decrease/increase.
CLDs are useful for formalizing mental models of individuals and groups, rapid identification of the possible drivers of the considered system’s dynamics, and communicating feedback and archetypal structures in the considered system [20]. CLDs can be used as a standalone qualitative modeling tool or as a step toward developing a quantitative simulation, e.g., a system dynamics model [21].

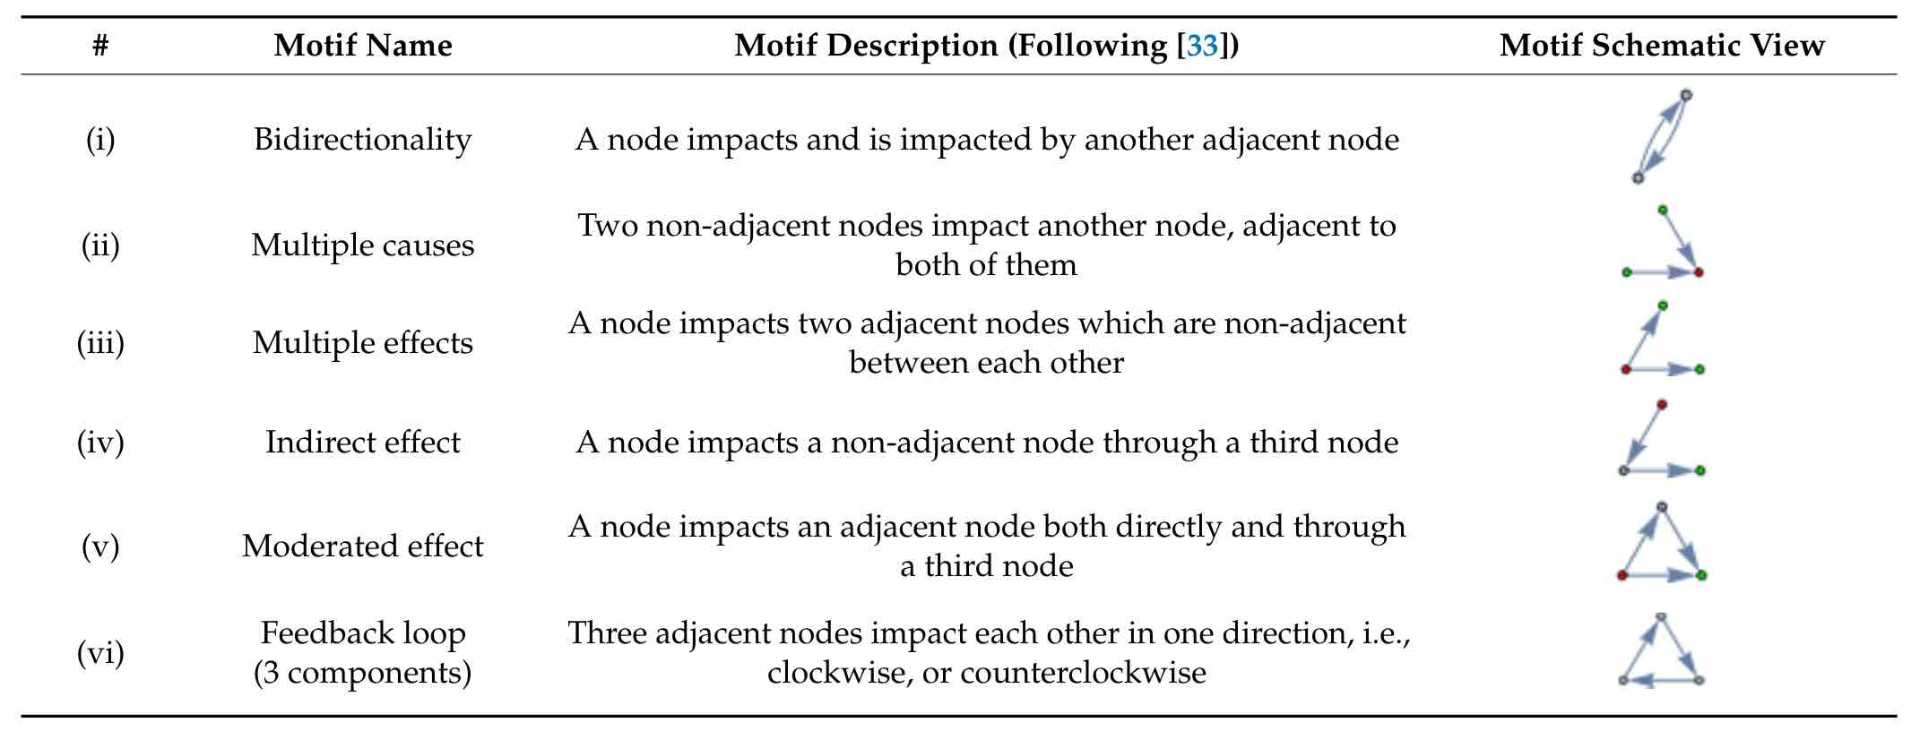
Table 2. Network motifs used for analysis.
Nodes highlighted with red depict impacting components, nodes highlighted with green depict impacted components. In the cases of bidirectionality and feedback loops, it is assumed that there is no dominant impact in any direction.
~
STRELKOVSKII, Nikita and ROVENSKAYA, Elena, 2021. Causal Loop Diagramming of Socioeconomic Impacts of COVID-19: State-of-the-Art, Gaps and Good Practices. Systems. Online. September 2021. Vol. 9, no. 3, p. 65. [Accessed 17 March 2023]. DOI 10.3390/systems9030065. The complexity, multidimensionality, and persistence of the COVID-19 pandemic have prompted both researchers and policymakers to turn to transdisciplinary methods in dealing with the wickedness of the crisis. While there are increasing calls to use systems thinking to address the intricacy of COVID-19, examples of practical applications of systems thinking are still scarce. We revealed and reviewed eight studies which developed causal loop diagrams (CLDs) to assess the impact of the COVID-19 pandemic on a broader socioeconomic system. We find that major drivers across all studies are the magnitude of the infection spread and government interventions to curb the pandemic, while the most impacted variables are public perception of the pandemic and the risk of infection. The reviewed COVID-19 CLDs consistently exhibit certain complexity patterns, for example, they contain a higher number of two- and three-element feedback loops than comparable random networks. However, they fall short in representing linear complexity such as multiple causes and effects, as well as cascading impacts. We also discuss good practices for creating and presenting CLDs using the reviewed diagrams as illustration. We suggest that increasing transparency and rigor of the CLD development processes can help to overcome the lack of systems thinking applications to address the challenges of the COVID-19 crisis.
Supplementary material to the paper “Causal loop diagramming of socio‐economic impacts of COVID‐19: State‐of‐the‐art, gaps and good practices” zip ![]() (pdf)
(pdf)
Concepts used in the reviewed CLDs [⇒ Create a List of Variables]
20. Sterman, J.D. Business Dynamics: System Thinking and Modeling for a Complex World; Irwin McGraw-Hill: Boston, MA, USA, 2001. uri ![]() (download)
(download)
. 21. Homer, J.; Oliva, R. Maps and models in system dynamics: A response to Coyle. Syst. Dyn. Rev. 2001, 17, 347–355. doi ![]()
~
Here I am sharing the tools I have used for causal loop diagramming:-