
Ward had a way he liked to draw program traces. We were thinking that we'd like to get Smalltalk to draw these diagrams. But neither the Workspace that ran programs or the Inspector that examined object that held them had all of the trace information. So we looked at the source code for the Debugger and it include the method:
aCompiledMethod interpretNextInstructionFor: aContext
Then it was obvious, our drawing editor was just another Context and the Debugger would send us everything we needed. See also Access the Run-Time Stack
Kent Beck and Ward Cunningham have extended the debugger to make program traces available for inclusion in a document (see below).
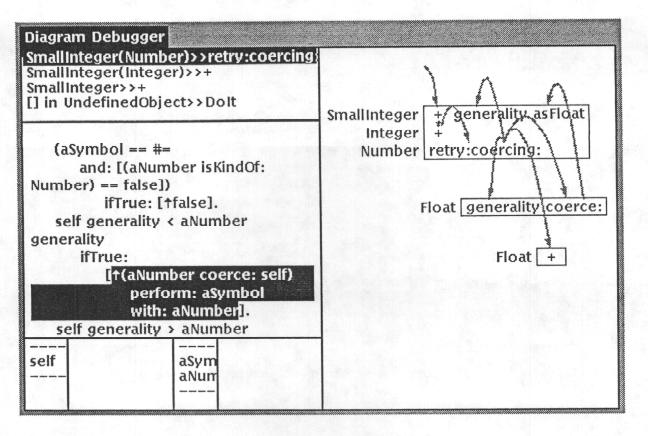
Diagram Debugger c2 ![]()
⇒ coerce Cf. coax ⇒ generality
An additional pane in the debugger lets the programmer selectively include message sends in a diagrammatic representation we have created specifically for object-oriented programs [Cunn86]. These diagrams can be copied from the debugger and pasted into a literate program.
[Cunn86] Ward Cunningham and Kent Beck, "A Diagram for Object-Oriented Programs,” in Proc. ACM Conference on Object-Oriented Programming Systems, Languages and Applications, Portland, Oregon, 1986. pdf ![]()
**Note**: The `interpretNextInstructionFor:` method also exists in a current g**t** image.

InstructionStream>>#interpretNextInstructionFor:
aCompiledMethod interpretNextInstructionFor: aContext