
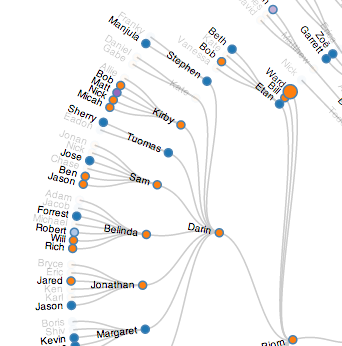
A February 2014 section of the org chart while hovering over myself.
Ward paired with Gabe O'Brien to render their company's organization chart on a single dynamic page animated eventually with start-date information.
Gabe already had a server call that would deliver org chart data as a json file. We hacked the d3.js example Radial Reingold–Tilford Tree to run from that. blocks ![]()
In later iterations we made it gray not-yet-hired employees when hovering over any individual. Later still, we changed the end-hover animation to restore color to employees in the order they were hired.