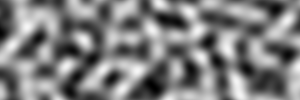
A common way to generate 2D maps is to use a bandwidth-limited noise function, such as Simplex or Perlin noise, as a building block. page ![]()
This is what the noise function looks like:

We assign each location on the map a number from 0.0 to 1.0. In this image, 0.0 is black and 1.0 is white. Here’s how to set the color at each grid location in C-like syntax:
for (int y = 0; y < height; y++) { for (int x = 0; x < width; x++) { double nx = x/width - 0.5, ny = y/height - 0.5; value[y][x] = noise(nx, ny); } }
The loop will work the same in Javascript, Python, Haxe, C++, C#, Java, and most other popular languages, so I’ll show it in C-like syntax and you can convert it to the language you’re using. In the rest of the tutorial, I’ll show how the loop body (the value[y][x]=… line) changes as we add more features. At the end, I’ll show a complete example. (See Playground ![]() )
)
Depending on the library you use, you may have to shift or multiply the values you get back to fit into the 0.0 to 1.0 range. Some libraries return 0.0 to 1.0; some return -1.0 to +1.0; some return other ranges like -0.7 to +0.7. Some don’t say what they return, so you may have to look at the return values to figure out the range.
DOT strict digraph rankdir=LR node [style=filled fillcolor=lightyellow penwidth=3 color=black fontname="Helvetica"] HERE NODE node [style=filled fillcolor=lightblue] WHERE /^Next/ LINKS HERE -> NODE node [style=filled fillcolor=white] HERE NODE WHERE /^Next/ LINKS HERE -> NODE node [style=filled fillcolor=white penwidth=3 color=black] LINKS HERE -> NODE node [style=filled fillcolor=white penwidth=1 color=black] HERE NODE LINKS HERE -> NODE node [style="filled,rounded,dotted" fillcolor=white] edge [style=dotted] HERE NODE