Demonstrations of the Ordering Process
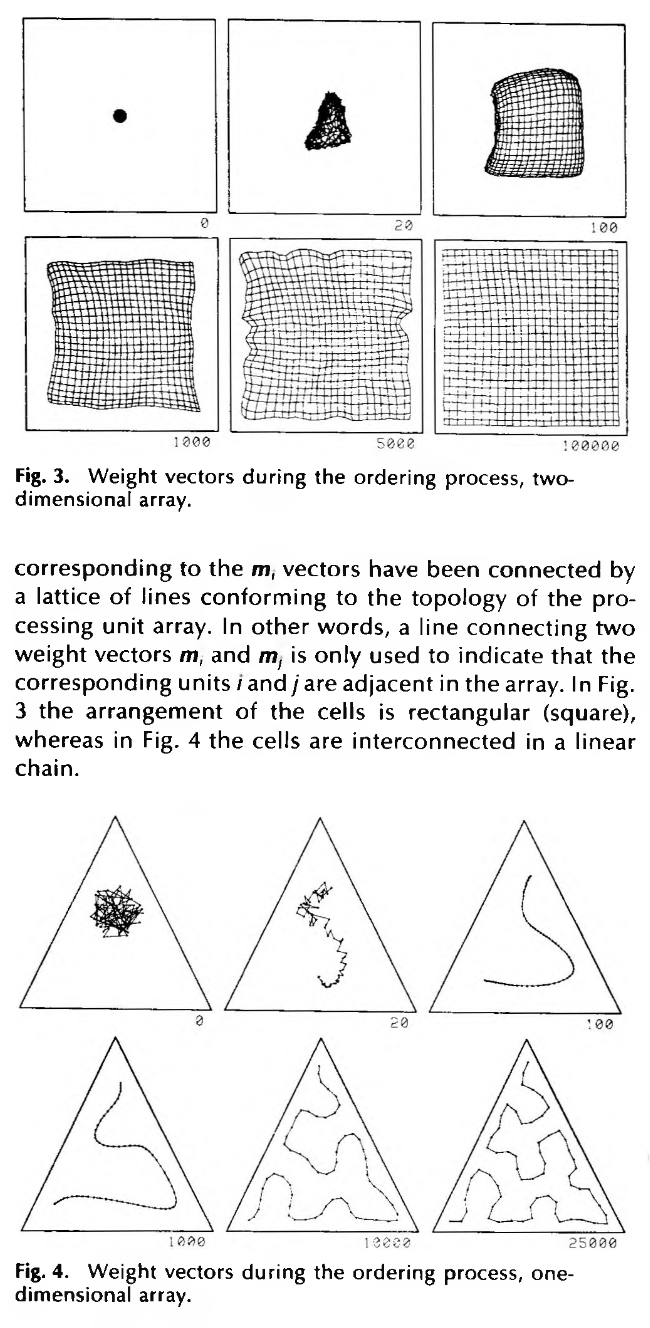
The first computer simulations presented here are intended to illustrate the effect that the weight vectors tend to approximate to the density function of the input vectors in an orderly fashion. In these examples, the input vectors were chosen to be two-dimensional for visual display purposes, and their probability density function was arbitrarily selected to be uniform over the area demarcated by the borderlines (square or triangle). Outside the frame the density was zero. The vectors x(t) were drawn from this density function independently and at random, after which they caused adaptive changes in the weight vectors m_i.
The m_i vectors appear as points in the same coordinate system as that in which the x(t) are represented; in order to indicate to which unit each m_1 value belongs, the points corresponding to the m_i vectors have been connected by a lattice of lines conforming to the topology of the processing unit array.
In other words, a line connecting two weight vectors m_i and m_j is only used to indicate that the corresponding units i and j are adjacent in the array. In Fig. 3 the arrangement of the cells is rectangular (square), whereas in Fig. 4 the cells are interconnected in a linear chain.
