The routing structure of the entire FPGA could be described by a Graph, called routing graph, where vertices model logic blocks and switch boxes while the edges correspond to wiring segments or *programmable interconnect points* (PIPs).

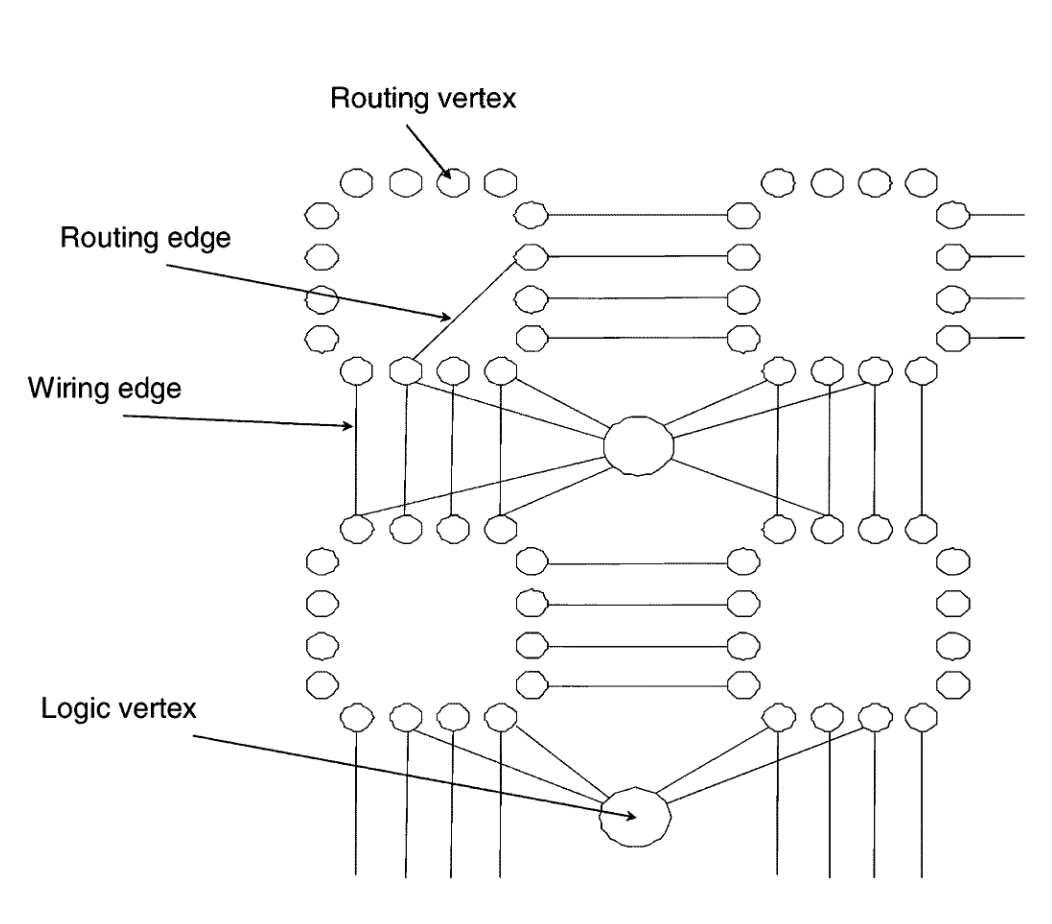
Fig. 5. Routing graph is composed of logic vertices modeling logic blocks, routing vertices modeling input/output ports of switch boxes, routing edges modeling PIP, and wiring edges modeling wiring segments.
In the model, shown in Fig. 5, we have two types of vertices.
* Logic vertices: They model the FPGAs logic blocks. * Routing vertices: They model the input/output ports of the switch boxes.
We also have two types of edges. * Routing edges: They model the PIPs, each represented as an edge that connects two routing vertices. * Wiring edges: They model the wiring segments. They allow logic vertices to connect to adjacent routing vertices.
The vertices corresponding to the FPGAs resources that are used to implement a circuit are colored. In case fault-tolerant architectures like TMR are used, different colors are used to mark the vertices of each circuit replica, as well as the majority voters.
According to our approach, the designer produces both the circuit description and the layout description, and then the back-end of the static analyzer tools parses the two files and builds the routing graph for the circuit under analysis. The designer obtains the circuit description through standard synthesis tools (like Synopsys’ FPGA compiler II, Symplicity’s Simplify, or Xilinx ISE) starting either from a schematic, or a behavioral model coded in a hardware description language. Similarly, the layout description is obtained through the place and route tools for the adopted FPGA device (like Xilinx’s PAR).
Moreover, the information coming from the place and route tools is complemented with information concerning the type of fault-tolerant architecture used to harden the circuit. […]
[…]
The routing graph is able to convey the information about SEUs’ effects, too. The effects of a SEU in the configuration memory are modeled by changing the coloring of the graph vertex corresponding to the resource affected by the SEU. The same approach is used to model the effect of one SEU altering a memory element used by the circuit. Moreover, effects on the routing are modeled through the addition of subtraction of edges (routing or wiring edges) to/from the routing graph.
The association between the elements of the routing graph and the corresponding bits of the configuration memory mandates a detailed knowledge of FPGAs architecture and of its configuration memory. For this purpose, we studied the architecture of the Xilinx’s configuration memory, we decoded it, and we identified the relationship between configuration-memory’s bits, FPGAs resources and routing-graph’s elements.
Although our works is based on Xilinx’s devices, the approach we developed is general, and it can be adopted for modeling devices coming from other manufactures.
[…]
~
STERPONE, Luca and VIOLANTE, Massimo, 2005. A new analytical approach to estimate the effects of SEUs in TMR architectures implemented through SRAM-based FPGAs. IEEE Transactions on Nuclear Science. 2005. Vol. 52, no. 6, p. 2217–2223. DOI 10.1109/TNS.2005.860745. [Accessed 4 January 2024].