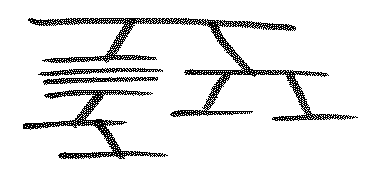
Ron Jeffries of Oak Tree Software draws diagrams that look like this:

c2.com
He draws objects as horizontal lines. Big objects can be quite long. Variable names go above the line, leaf values below. Ticks separate crowded names. He draws references as verticals slanting one way or the other. Sometimes a reference runs through a collection, as one does above. Ron shows a few of the collected objects in a pile and elaborates from its bottom.
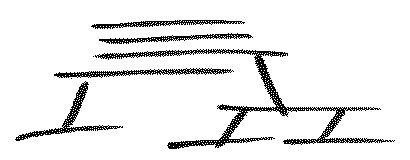
If there are different kinds of objects in the pile, and that's important, then he shows the variability like this:

c2.com
Ron works with tax accountants. They draw these pictures too. (Though, unlike him, they are without remorse for the violence they do to the concept of the diagram.)
I have duplicated Eric's descriptions from below here, so they're closer to the pictures. Got that from Edward Tufte. -- Manuel Simoni
Here's a try. The top diagram:
A :B: E C F G D
describes an object A which references a collection and a single object E. The collection holds objects B which each refer to one other object C. Each C points to a D. The object E references two other objects F and G. The second diagram:
:A: : B F : G C D E
describes a heterogenous collection A which includes object types B and F. An object B links to a C which uses D and E. An F links to one other object G. -- Eric Bennett
Question: Why does Ron draw these pictures?
To quote Sarek when Spock asked him why he married Amanda, Spock's mother: "At the time, it seemed to be the logical thing to do."
The Oak Tree Diagram system was used by tax professionals (not programmers) to define the processing for a tax preparation program. We gave them a little language to define the forms and the logic that underlay the forms.
Tax forms reference one another: "Line 23: Copy the total from Form 2119 Line 45". So the language built objects that explicitly represented references as parent-child relationships. In designing the system, I needed, early on, to understand the field calculations. I drew diagrams like
| income | deductions | tax = income - deductions | ---------------------------------------------------
When I began to draw sub-diagrams, where a "field" on the top record pointed to a record "below", I started drawing diagrams like this, with the fields all filled in and lines between:
| inc | decRec | ded | tax = inc - ded | ---------------------------------------- / | health | taxes | busExps | ... | ----------------------------------
As I became more interested in representing the structure, and less interested in the field-by-field detail, I stopped filling in the details. Voilà, Oak Tree Diagram(s).
At the time, they were very useful. Lately, I haven't needed them. If there's a general idea, it would be to use the minimum graphical notation you can get by with. These things could have been drawn in UML and would take pages each. The essence of what we really needed to communicate would fit on a card.
-- Ron Jeffries
There is a lot of potential in these simple diagrams as they show a lot in a small amount of space and yet aren't difficult to understand. Ron, keep innovating! -- Joshua Kerievsky
The pictures above look like they were drawn with a Japanese brush pen. Was that a deliberate choice, given their zen-like (See also Zen Concepts) simplicity when compared to ahem UML? -- Richard Emerson
I drew them with a felt pen on index cards. (Ron almost always worked at a whiteboard.) I was inexperienced with scanning at the time and was disappointed to see that the final images weren't solid black. I was aware that the raster images had a natural look that was not available with vector graphics. I probably oversimplified the diagrams, a point Ron later made in his 'character mode' contribution. -- Ward Cunningham
These diagrams don't mean anything to me. That's probably my fault, not the diagrams'. Of course, the text mode ones make sense and seem somewhat straightforward, but I still have no idea what the first two scanned-in models are trying to say. Can anyone help me? They certainly look pretty. -- Robert Di Falco
Here's a try. The top diagram:
A :B: E C F G D
describes an object A which references a collection and a single object E. The collection holds objects B which each refer to one other object C. Each C points to a D. The object E references two other objects F and G. The second diagram:
:A: : B F : G C D E
describes a heterogenous collection A which includes object types B and F. An object B links to a C which uses D and E. An F links to one other object G.
-- Eric Bennett
That was a great help, thanks! Sometimes I'm a little slow. --Robert Di Falco
Part of their power was in the drawing. I'd draw a structure, then be thinking, OK, but this is a record pointer, draw a little more. It helped me evolve the odd recursive nature of the problem and solution. -- Ron Jeffries
It seems to me that the descriptions of streams and substreams, trees and BDL on the Flow Based Programming web site fit in with this notation quite well - see www.jpaulmorrison.com ![]() . See also the J-D. Warnier notation, described in a number of web sites - there's a sample in www.jpaulmorrison.com
. See also the J-D. Warnier notation, described in a number of web sites - there's a sample in www.jpaulmorrison.com ![]() . --Paul Morrison
. --Paul Morrison

www.greencheese.us

www.gilmertonhouse.com
Phl Ip prefers his OTDs fully rendered: , but we all know the ones supplied by Parent Nature are best:
Isn't it so that really elegant solutions like these diagrams come into being when communicating with groups. I'm sure I'll need this idea eventually. (Wiki Gnomes: factor the preceding statement to that appropriate and well known quote by somebody famous. Thanks.)
Pretend I said something flattering about your intelligence, because you probably have a better imagination than I do.
A real programmer can't tell you the answer to your question, but he can tell you how to find it.
-- Bob Bockholt
See original on c2.com ![]()